All macromolecular structures from SARS-CoV and SARS-CoV-2 in the PDB are downloaded into our repository and assessed automatically in the first 24 hours after release. We do this to ensure that structural interpretations available to downstream users are as solid as possible.
The scripts for finding specific files can be found at https://github.com/thorn-lab/coronavirus_structural_task_force/tree/master/utils/Update_pipeline
Comparison between the model and prior knowledge about structures
Molecular geometry is constrained by the nature of its chemical bonds and steric hindrance between the atoms. In order to evaluate the model quality with respect to chemical prior knowledge we run MolProbity, which checks covalent geometry, conformational parameters of protein and RNA and steric clashes. However, it is unfortunately possible to use some of these traditional indicators of model quality as additional restraints during refinement, which invalidates them to a certain degree – we therefore also used the MolProbity CaBLAM score, which can pinpoint local errors at 3-4 Å resolution even if traditional criteria have been used as restraints. CaBLAM scores higher than 2% outliers indicated that 163 of the structures have many incorrect backbone conformations.
During the crisis the MolProbity webservice has been pushed to the limit of its capacity, as many different drug developers have screened the very same coronavirus structures many times. We have developed a bespoke MolProbity pipeline to make these results available online and to decrease the workload on the webservice. In addition to this, the sequence of each structure is also aligned and checked against the known genome to highlight misidentified residues. In addition to this, we check the quality of the deposited merged data, and how well the model fits these data:
For crystallographic data
As crystal structures make up the majority of our data, these are evaluated most thoroughly. Crystal diffraction can, for example, stem from more than one crystal lattice (twinning), be contaminated by ice crystal diffraction (ice rings) or be incomplete due to radiation damage or suboptimal measurement strategy. These issues cannot be resolved after data collection, but treating data accordingly can yield a better structural model. Deducing such problems from the deposited structure factors (mandatory in wwPDB) can be difficult; raw data allow a much more complete analysis of the experiment.
Another source of errors is data processing (integration and scaling), which nowadays is often done automatically. Assuming the wrong crystal lattice symmetry or including, for example, diffraction spots obscured by the beam stop, can lead to lower quality or even unsolvable structures. If raw data are available, data can be re-processed and these problems can be resolved manually.
These are the tools we use specifically: phenix.xtriage to evaluate crystallographic data for twinning, completeness, and overall diffraction quality. The reports are located in validation/ under the PDB entry directory.
AUSPEX: Automatically identifies ice rings and produces plots from which several other pathologies, such as a “bad” beam stop mask, can be recognized quickly. The AUSPEX plots and the corresponding (non-automatic) comments are located in validation/auspex under the PDB entry directory.
A general indication of how well the atomic model fits the measurement data can be obtained by comparing the deposited R-factors to results from PDB-REDO (including Whatcheck) to determine the overall density fit as well as many other diagnostics. While the deposited structures are often improved by PDB-REDO, they need to be checked and should not be viewed as “more correct” purely on basis of a lower R value. In addition to this, a high R value does not indicate a single type of error and hence should be used with caution. The outputs are located in validation/pdb-redo under the PDB entry directory.
For Cryo-EM data
Cryo-EM structures make up approximately 15% of our data. As with crystallographic structures, raw data are not available from the wwPDB, but the three-dimensional map reconstructed from the microscopic single particle images is deposited, allowing the calculation of the fit between model and map in the form of a Fourier Shell Correlation (FSC). The model-map FSC is plotted as a curve, which estimates agreement between features resolvable at different resolutions. For a well-fitted model, a model-map FSC of 0.5 roughly corresponds to the cryo-EM map resolution (which is determined as where the FSC between two half-maps drops below 0.143). To calculate FSCs, we use the CCP-EM model validation task which utilizes REFMAC5 and calculates real-space Cross-Correlation Coefficient (CCC), Mutual Information (MI) and Segment Manders’ Overlap Coefficient (SMOC). While MI is a single value score to evaluate how well model and map agree, the SMOC score evaluates the fit of each modelled residue individually and can help to find regions where errors occur in the model in relation to the map. Z-scores highlight residues with a low score relative to their neighbours and point to potential misfits.
In addition to this validation, we run Haruspex, a neural network to annotate reconstruction maps to evaluate which secondary structures can be recognized automatically in the map.
Manual evaluation
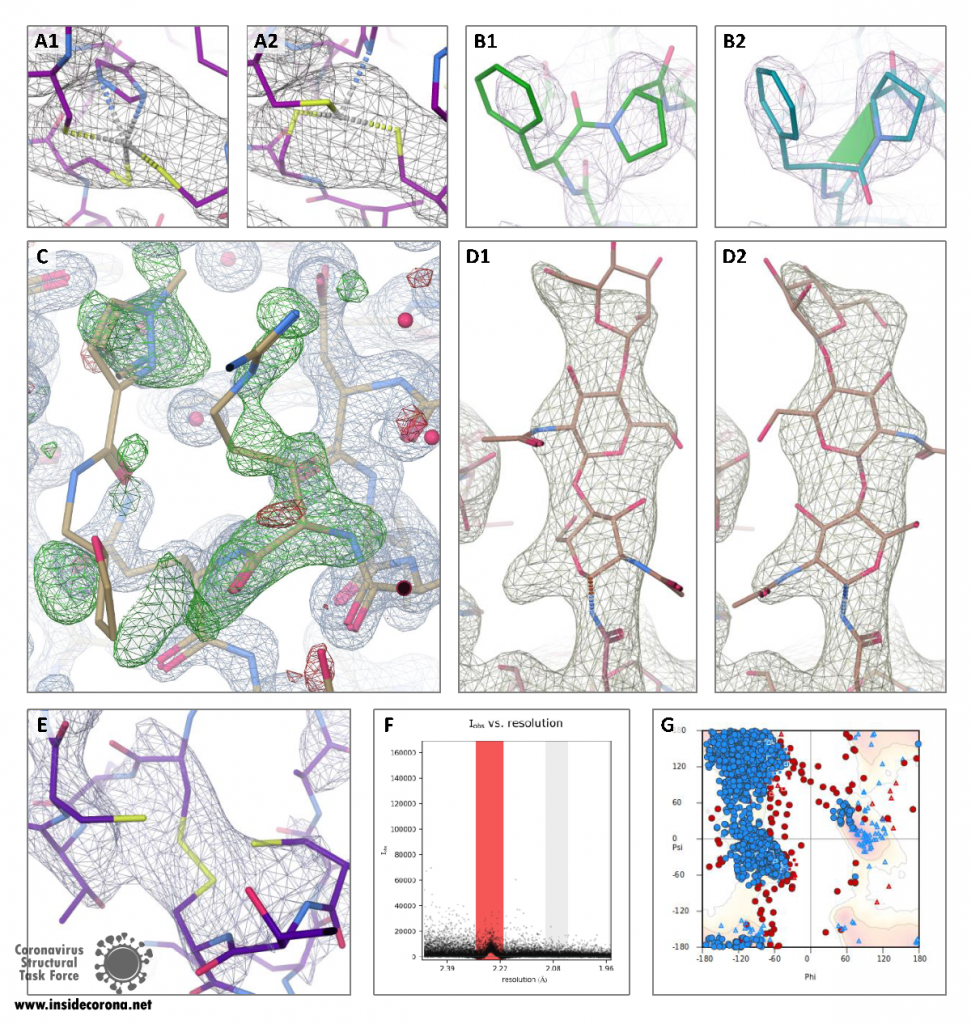
Even with state-of-the-art automatic methods at hand, experienced human inspection residue-by-residue remains the best way to judge the quality of a structure, highlighting the continuing need for expert structure solvers. Given the flood of new SARS-CoV-2 structures, resources have not permitted us to check all structures manually. Therefore, we have selected several representative structures to give a residue-by-residue inspection by our expert structure solvers. The structures that have been reprocessed manually can be found here. Here are some examples of what we look out for:

Information Aggregation
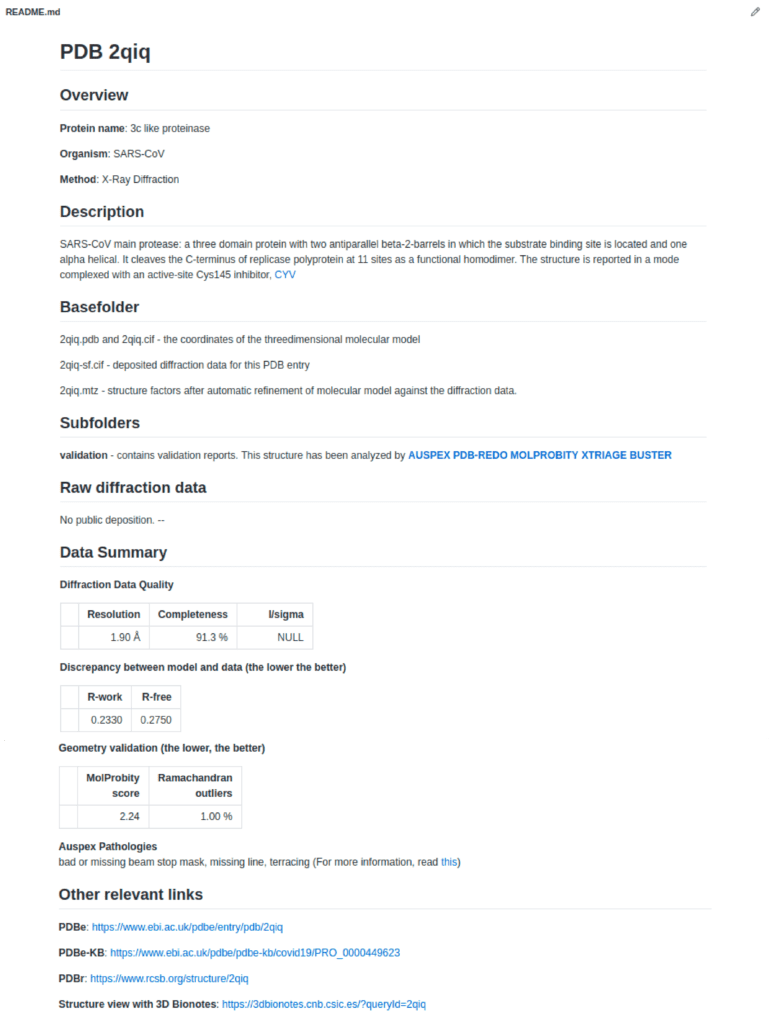
The most important information about any single structure is gathered in the README.md in each PDB entry directory. Online users can directly visualise the reports in the browser.

If the raw data (diffraction images for X-ray diffraction data, primary maps for cryo-em data) are available from dedicated databases, a link will be provided.
A data summary is generated to give an overview on the results of the automatic validation which includes data quality, model quality, geometric scores and AUSPEX pathologies.
Other useful links such as to the PDBe knowledge base or the 3D bionotes structural viewer are also included.
