How reliable is the Pfizer-BioNTech claim that their vaccine is 90 percent effective?

December 10, 2020
Dale Tronrud

On Nov 9th, 2020 Pfizer issued a press release stating their conclusion that the COVID-19 vaccine they developed with BioNTech appeared to be 90% effective. While their test contained over 43,000 volunteers they had only detected 94 cases of COVID-19. How confident can you be with only 94 cases? I decided to explore this matter for myself.

I am but a lowly crystallographer, and I’m sure a proper mathematician could do a more rigorous job, but I’ll do the best I can.

The Experimental Design

I was not familiar with the design of this clinical trial but it seems rather straight-forward. You take a whole lot of people and split them into two groups, keeping their group assignment secret from everyone who will be involved in their handling until the end of the trial. The members of one group are given the treatment which we hope is a vaccine while the others are given a sham treatment which is indistinguishable from the “vaccine” by both the participants and their doctors. You then wait to see if anybody comes down with COVID-19.

How long do you wait? You want to wait until you have enough cases to reliably answer the question you hope the study will answer but, to avoid bias, the end point has to be set before the start. If you constantly watch the results and decide to stop when the numbers look good, you could claim success when there is none. After all, life is filled with statistical fluctuations and the results might get worst with longer time.

The press release says that the design of this test says to end after 164 cases of COVID-19 arose among the volunteers but they would peek at the results after 32, 62, and 94 cases. For unspecified reasons they skipped the peek at 32 and, it appears, that the case count shot up to the 94 case trigger while they were discussing the merit of the 62 threshold. I guess this is the only benefit to the world of the huge surge in COVID-19 cases this fall.

It was the 94 case checkpoint that led them to conclude that it was likely that their vaccine candidate was 90% effective at preventing the disease.

But how likely?

To judge the reliability of the 90% number I’ll need to do some statistics. That “proper mathematician” I mentioned earlier would be able to pull out the expected distributions for the experimental results and precisely calculate probabilities and likelihoods. That knowledge is not in my skill set so I’m left with running simulations.

I wrote a program in Mathematica Script to generate many simulations of vaccine trials and then examined their variability. This program has a loop that produces a person with a 100% chance of developing COVID-19 without intervention. That person is assigned either to the Placebo or Vaccinated group.  Those poor souls put in the Placebo group are counted as COVID-19 cases. Those in the Vaccinated group are only sickened if they lose a roll of the dice. For each series of simulations I assume a level of effectively for the vaccine. If the run is for a vaccine with 30% effectiveness, for example, the volunteer only get sick if they roll over 30 (okay, I’m using percentile dice.) Those folk protected by the vaccine are let go and the sick are counted as vaccine failures. When the total number of sick reaches the target that trial is complete, the number of sick in each group recorded, and the next trial is started. To ensure that I have a good sample of all possible clinical trials, I simulated a hundred thousand trials for each assumed efficacy.

To keep the numbers simple I ran 100 case trials instead of 94.

When the vaccine is ineffective (can we still call such a thing a vaccine?) there will be an equal number of COVID-19 cases in the Placebo and Vaccinated groups, and this number will be around 50 but there will be variation. If the vaccine is 100% effective the vaccinated group will be completely protected and all 100 cases will be in the Placebo group. The key result of a vaccine trial is the difference in the number of cases. This difference can never be greater than 100 because there aren’t enough cases to result in a bigger number. The difference can, however, be negative since it is possible to have more cases in the Vaccinated group.  The most likely explanation for such a result is that the vaccine is very ineffective and randomness of infections happens to result this odd distribution.

Here are my results for a series of hypothetical vaccines with varying efficacy.
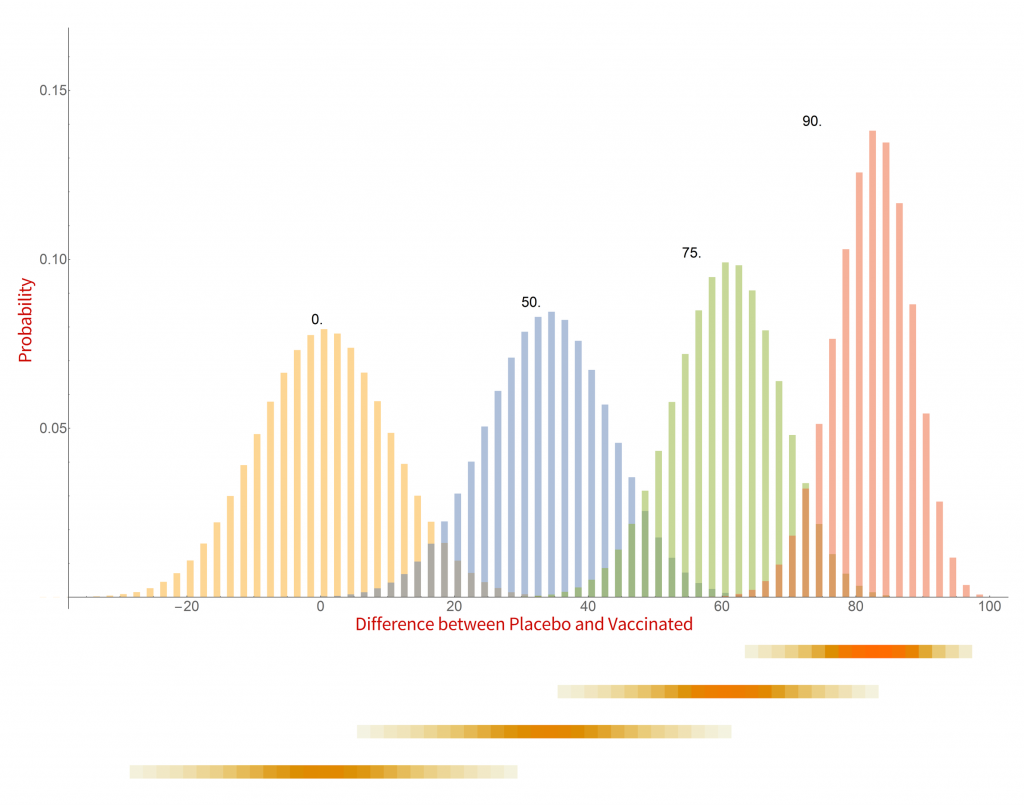
Plot showing four overlapping histograms, one each for 0%, 50%, 75% and 90% effective vaccines centered on differences of 0, 34, 60 and 82 cases. Each overlaps half of its neighbors’ width. Below the plot are four horizontal lines, each matching one histogram. Where the histogram is taller the color of the line is darker.

Histograms of the probability of a clinical trial of a vaccine with an assumed efficacy resulting in a particular difference in COVID-19 case numbers between the placebo and vaccinated groups. CC-BY-NC Dale E. Tronrud / Coronavirus Structural Task Force

There are a whole lot of interesting things in this graph. When the vaccine is completely ineffective the most common result of a trial is a difference of zero between the Placebo and Vaccinated groups. There is a fairly wide distribution of results that occur, however. This is the result of statistical fluctuations due to the small number of cases of COVID-19 in the sample (here 100).  The distributions for all the simulated efficacies have about the same width, with the exception of those near 100%. Since the difference can never be larger than 100 those distributions get sharper and develop a tail on the lower side.

Let’s look at some scenarios. The graph shows that the most common result of a trial of a vaccine with efficacy of 50% has a difference in number of cases between the Placebo and Vaccinated groups of 36, but sometimes the difference is larger and sometimes smaller. If the vaccine was worthless the most common trial result is zero, but there is also variability. The two histograms overlap considerably which indicates that one cannot distinguish between an efficacy of zero or 50% if the difference in the number of cases in your trial is in the range of zero to about 36. If the difference is greater than this you could conclude that the vaccine is more likely to be 50% than zero percent, and zero percent is the more likely of the two if the difference is negative. Still, there is a wide range of possible outcomes of a trial that have ambiguous interpretation.

On the other hand, what if we have a difference of 80 (90 cases in the Placebo group and 10 in the Vaccinated group)? There isn’t any significant overlap between zero percent efficacy and 90% at the point where the difference is 80. It is much more likely that the vaccine is 90% effective than zero. There is overlap with the 75% effectiveness histogram and we have to admit that it is possible that the vaccine is only 75% effective, but 90% is more likely.

This leads us to realize that the result of a vaccine trial has to result in a range of possible efficacies, with a varying probability of each. My little plot doesn’t make such an assessment very easy. In fact, the plot is starting to show some problems. What it shows is the probability of a trial having a particular result given the effectiveness of the vaccine. What we really want is the probability of each possible efficacy given the result of the clinical trial.

We have to transform our probabilities!

Turning everything on its head

While the calculations I just discussed were easy to set up and understand, they do not really reflect the experiment being done in a vaccine trial. I was assuming an effectiveness of the vaccine and running many, many trials. In reality the effectiveness is unknown and only one trial is run. Where I calculated the probability of a particular difference in COVID-19 cases given the effectiveness of the vaccine what I really want is the probability of the effectiveness of the vaccine given the results of a single clinical trial. It is often difficult to devise such a calculation from scratch but it is pretty straight forward to calculate it from the results I already have.

The first step toward the proper calculation is to expand the current plot. My first figure included simulations of just four possible efficacies. To display more possibilities, I need to abandon histograms. At the bottom of the plot I show four color-shaded bars. In these bars the color is darker when the corresponding histogram is taller. While not as visually clear these bars have the advantage that they can be stacked, and many more plotted in a single figure.

With this new tool I can calculate and display the simulated distribution of clinical trials for every vaccine efficacy from 0% to 100% in 1% steps. The new chart is displayed here.
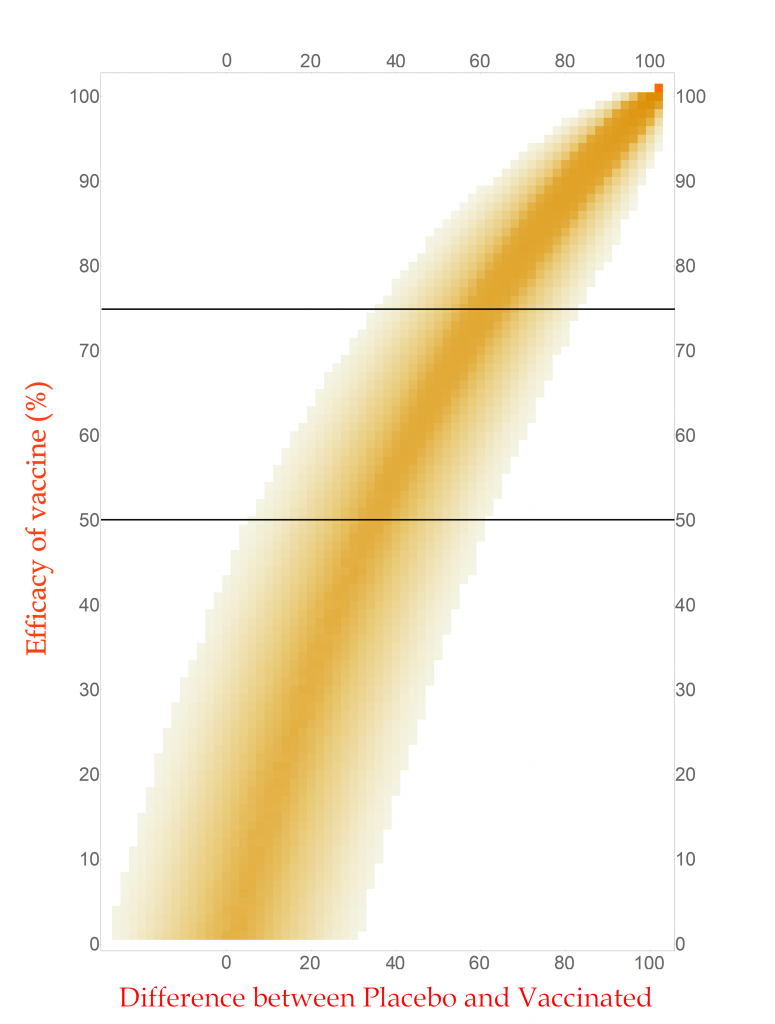
Plot showing the difference between the number of cases in the Placebo group and the number in the Vaccinated group on the horizontal axis and the vaccine effectiveness on the vertical. There is a band of color, darkest in the center, which stands vertically in the plot leaning to the right and touching the upper right corner. Its bottom, at zero efficacy, has its darkest region right above a difference of zero. There is a line at 50% efficacy and the width of the band goes from about 5 to 70 centered on about 40. Another line is drawn at 75%. The band here goes from the upper 30’s to about 90 with a most probable value of around 65
Distribution of possible clinical trial outcomes for a given vaccine efficacy.
CC-BY-NC Dale E. Tronrud / Coronavirus Structural Task Force

This chart is read by locating the efficacy of your vaccine on the vertical axis and drawing a horizontal line there. The pattern of colors along that line represents the probability of each difference in cases between the Placebo and Vaccinated groups in a clinical trial. I have drawn two such lines, one for a vaccine with 75% effectiveness and another for one with 50%. You can see that the most likely result for the 75% one is about 60 cases (20 in Vaccinated and 80 in Placebo) and the other at about 34 cases. (You figure it out.) In this plot you can see the continuous change as the efficacy of the vaccine is changed. The key point is that there is a spread of results, but I described that before.

With any set of probabilities the full set has to always add up to one. For each horizontal line of colored boxes in this plot the sum of their probabilities is one. A set of numbers with this property is said to be “normalized”.

The vertical lines are not normalized in this plot, as you can see by looking at its left side. There are just a few, very lightly colored or low probability boxes and above them is simply white, which represents zero probability (or at least very, very, very small). This side of the plot has a difference in COVID-19 cases of -24, or in other words the Vaccinated group had 24 more cases of disease than the Placebo. Such an outcome for a clinical trial is very unlikely for any vaccine that has even a tiny amount of success (and is pretty unlikely for one that is merely useless).

Since the probabilities along vertical lines are not normalized they cannot be used as a histogram. Conveniently for us, this can be corrected simply by normalizing them.  This is done by summing all the probabilities along each vertical line in this plot and dividing the probabilities in the line by that sum.  This gives us a new set of probabilities and a new plot.

How does this magic work? The procedure is justified by a hundreds-of-years-old mathematical theorem called Bayes’s Law. This blog post is already getting long and I leave the application of your favorite search engine to you.
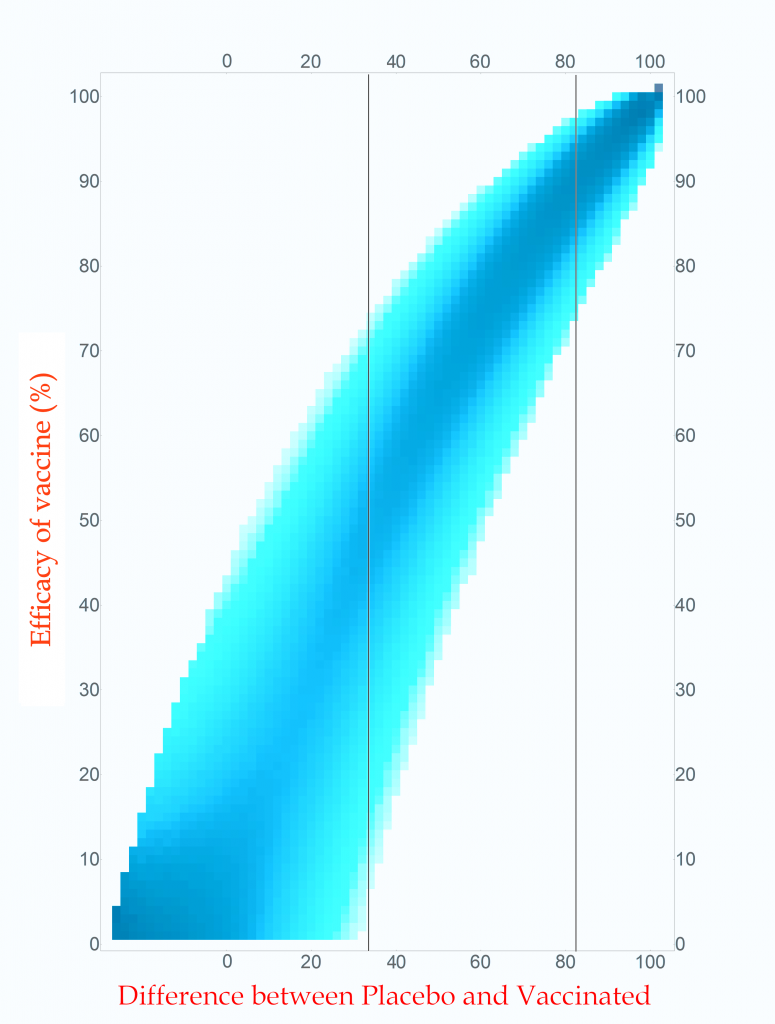
This plot is very similar to the last with the largest difference in the lower left corner. Here it indicates that the most likely effectiveness of the vaccine with more COVID-19 cases in the Vaccinated group than Placebo is near zero

Probability of vaccine effectiveness as a function of clinical trial outcome.
CC-BY-NC Dale E. Tronrud / Coronavirus Structural Task Force

The first thing to note is that the new plot isn’t much different than the original. While the lower-left side has clearly changed, that area is not very interesting. On the right, where the action is, it looks the same. For this reason, many fields of science simply use the unnormalized plot.

The new plot allows us to draw vertical lines (but forbids horizontal lines!). I have drawn example lines at differences of 36 cases and 82 cases. If our clinical trial results in a difference in cases of 82 (91 in Placebo and 9 in Vaccinated) we can see from the line on the plot that the most probable effectiveness of that vaccine is about 90%! This is very close to the happy number reported in Pfizer’s press release. The plot also shows us that there is uncertainty in this number. The vaccine’s effectiveness could be in the mid 70’s or in the upper 90’s.

This is the nature of all experimental work. All results have uncertainties and it is as important to know the amount of uncertainty as it is to know the direct result. You can see how important this is by looking at the 36 case difference line. The darkest blocks along this line, and therefore the most probable efficacy, are near 50%. This would also indicate a useful vaccine, but look at the spread! The width of the uncertainty goes all the way to zero – This vaccine could be worthless. A clinical trial that waited until only 100 cases occurred cannot distinguish between a vaccine with 50% efficacy and a worthless one.

If you wait for more cases to develop the width of the stripe in the plot becomes narrower and the uncertainty drops. The goal of Pfizer was to develop a vaccine of at least 50% efficacy so their design was to wait for 164 cases to give them a narrow enough band to clearly distinguish 50% from zero percent. Just in case the vaccine was better than 50% they built into the design of their trial several points where they could peek and see what was going on. They, and we, lucked out!

What are all those other people for?

The surprising thing about this analysis is that the total number of people in the trial is unimportant when calculating the uncertainty of the result. That answer is the same for a trial with 500 volunteers and a trial with 50,000 volunteers. The only thing that is important is the number of cases of COVID-19.

All those tens of thousands of people are important for other reasons. Very relevant to the current pandemic is that a larger number of volunteers will accumulate the target number of cases sooner: if you double the number of volunteers you will reach the target in half the time. We all want to know as quickly as possible if these vaccines are effective so we want the trials to consist of as many people as the companies can manage.

The other use for large numbers is the search for grim and hopefully rare side effects. These are likely to arise at much lower rates than viral infections and much larger numbers of volunteers are required to achieve statistical significance. A side effect that only occurs in 1 of 5,000 people will require a very large number of participants to be detected. A compounding factor is that a search for an unknown result requires many more data points than the search for a specific outcome, such as COVID-19 infection. (The checks for side effects are only now being described to the public, and I’ll not go into them here.) While the doctors keep an eye out for life threatening problems during the trial, the secret books identifying which volunteers are in which group are kept closed until the end.

End game

After all this interesting math I find that, yes, 94 diseased people are quite enough to conclude that a vaccine is effective at around a 90% level, or at least 70%.

Postscript

During the writing of this post Moderna issued a press release about their vaccine candidate. The analysis presented here applies equally to their trial since I made no assumptions at all about the nature of the vaccine being tested. The only complaint I have with their press release is that they quoted the effectiveness of their vaccine as 94.5%. As you now know, this level of precision is ridiculous.  It would be better just to say it is “somewhere around 95% effective”.

Corinna the Corona Cactus

@
Corinna works as an outreach person for all plant-related business and as a mascot. She gathered previous experience in the garden center, and even though she can be a bit spiky, she likes to cuddle and lie in the sun.
More about this author

Helen Ginn

Senior Research Scientist @ Diamond Light Source, Oxfordshire, UK
Dr Helen Ginn is a senior research scientist at Diamond Light Source in the UK and a computational methods developer in structural biology. She is currently working on Representation of Protein Entities (RoPE) for structural biologists to interpret subtle conformational changes in dynamic protein systems. She has developed Vagabond for torsion angle-driven model refinement and […]
More about this author

Nick Pearce

Assistant Professor @ SciLifeLab DDLS Fellow
Nick obtained his undergraduate degree in Physics from the University of Oxford in 2012, and then his PhD in Systems Approaches to Biomedical Sciences in 2016. He moved to Utrecht in the Netherlands in 2017 to work with Piet Gros, where he obtained an EMBO long-term fellowship and worked on analysing disorder in macromolecular structures. […]
More about this author

Mathias Schmidt

Molecular Life Sciences M.Sc. Student @ Hamburg University
Mathias is currently doing his Master's degree in Molecular Life Sciences at the University of Hamburg and has been an auxiliary scientist in the Corona Structural Taskforce since March 2022. There he is working on the question of the origin of SARS-CoV-2. His undergraduate research focuses on the development of synthetic molecular mechanisms to regulate […]
More about this author

David Briggs

Principal Laboratory Research Scientist @ Francis Crick Institute in London, UK
David Briggs is a Principal Laboratory Research Scientist in the Signalling and Structural Biology lab at the Francis Crick Institute in London, UK. A crystallographer by training, his work focuses on the biophysical and structural characterisation of human extracellular proteins involved in the synapse, which have important ramifications in both psychiatric and neurodegenerative disorders. He […]
More about this author

Lisa Schmidt

Web Developer and Illustrator @ Mullana
Lisa Schmidt is a freelance illustrator who studied Multimedia and Communication (BA) in Ansbach, Germany. Her work is focused on visualising topics around science and technology. She joined the Coronavirus Structural Task Force as media designer, where she does web design, 3D rendering for scientific illustrations and outreach work.
More about this author

Philip Wehling

Nanosciences M.Sc. Student @ Institute for Nanostructure and Solid-State Physics, Hamburg University
Philip has long had an enthusiasm for biological processes which is paired with an analytical understanding of the world. After having worked for a long time as a registered nurse in various fields, he first studied mathematics and finally nanosciences. During a lecture series in preparation for a bachelor's thesis, he came into contact with […]
More about this author

Binisha Karki

Postdoctoral Research Associate @ BioNTech SE
Binisha works as a research associate at BioNTech where she works on the development of COVID-19 vaccine and cancer immunotherapies. She graduated as a Molecular Biology major from Southeastern Louisiana University in May 2019. Post-graduation she worked as a research technician in the Chodera Lab performing biophysical measurements of model protein-ligand systems for computational chemistry […]
More about this author

Binisha Karki

Wissenschaftliche Mitarbeiterin @ BioNTech SE
Binisha ist als wissenschaftliche Mitarbeiterin bei BioNTech angestellt und arbeitet an der Entwicklung von Impfstoffen gegen COVID-19 sowie Krebsimmuntherapien. Sie beendete ihr Studium der Molekularbiologie an der Southeastern Louisiana University im Mai 2019. Anschließend arbeitete sie als Forschungstechnikerin im Chodera-Lab, wo sie biophysikalische Messungen an Modellen von Protein-Liganden-Systeme für computerchemische Benchmarks durchführte.
More about this author

Hauke Hillen

Assistant Professor at the University Medical Center Göttingen & Group Leader at the MPI for Biophysical Chemistry @ University Medical Center Göttingen
Hauke ist Biochemiker und Strukturbiologe. Mit seinem Forschungsteam untersucht er mittels Röntgenkristallografie und Kryo-Elektronenmikroskopie die Struktur und Funktion von molekularen Maschinen, die für die Genexpression in eukaryotischen Zellen verantwortlich sind. Er interessiert sich dabei besonders dafür wie genetisches Material außerhalb des Zellkerns exprimiert wird, zum Beispiel in menschlichen Mitochondrien oder durch Viren im Zytoplasma.
More about this author

Richardson Lab

Richardson Lab @ Duke University, Durham, North Carolina, USA
The long-term goal of the Richardson lab is to contribute to a deeper understanding of the 3D structures of proteins and RNA, including their description, determinants, folding, evolution, and control. Their approaches include structural bioinformatics, macromolecular crystallography, molecular graphics, analysis of structures, and methods development, currently focussed on the improvement of structural accuracy. In this […]
More about this author

Holger Theymann

Agile Leadership Coach @ mehr-Freu.de GmbH
Holger keeps websites running. He makes data from scientific databases appear in nice tables. He also has an eye on keeping the sites fast, safe and reliable. His experience as a software developer, systems architect, agile project manager and coach enabled the Task Force to get the whole process well organized and he even taught […]
More about this author

Florens Fischer

Biology M.Sc. Student @ Rudolf Virchow Center, Würzburg University
Florens is studying biology (M.Sc.) and worked in the Task Force as a student assistant. He has focused on bioinformatics and supports the work on automation of scripts and structuralization of big data with machine learning. He also supported the team in other areas, such as scientific research.
More about this author

Ezika Joshua Onyeka

Public Health M.Sc. student @ Hamburg University of Applied Sciences
Joshua joined Thorn Lab as a student assistant. He is a Public Health practitioner, holds a bachelor's degree in Public Health and is currently enrolled at Hamburg University of Applied Sciences for his MPH. He has helped in implementing some vaccination programmes to improve immunisation coverage and training of immunisation frontline health workers. For the […]
More about this author

Katharina Hoffmann

Molecular Biology M.Sc. student @ Institut für Nanostruktur und Festkörperphysik, Universität Hamburg
Katharina worked as a student assistant at Thorn Lab. Normally, she studies molecular biology at the University of Hamburg. In her master's thesis, which was put on hold by Corona, she is working on the interruption of bacterial communication. Since the lockdown, she has been digging around in databases and analyzing sequences. She never thought […]
More about this author

Nicole Dörfel

Media Designer @
Nicole Dörfel ensures that we and our work are looking good! She is the illustrator, media designer and the artistic soul of the Task Force. She works her magic both in print and digitally—her focus is general media design. In the Task Force, she is mainly responsible for graphics, photo editing, design of all our […]
More about this author

Pairoh Seeliger

Administration Assistant @ Institute for Nanostructure and Solid-State Physics, Hamburg University
Pairoh Seeliger is the admin wizard of the Task Force. She takes care of media requests, handles any logistical issues that come up and makes sure our science doesn’t sound too complicated in our German outreach efforts. She self-describes as "a jack of all trades with a University education in German studies and business administration, […]
More about this author

Oliver Kippes

Biochemistry B.Sc. Student @ Rudolf Virchow Center, Würzburg University
Oli is studying biochemistry (B.Sc) and has completed a training as an IT specialist prior to his studies. With the combined knowledge of his studies and training, he helps maintaining the structural database, programs applications for it and supports the team in literature research. In spite of his study, structural biology was still a new […]
More about this author

Luise Kandler

Biochemistry B.Sc. Student @ Rudolf-Virchow Center, Würzburg University
Luise is a B.Sc. student in biochemistry at the University of Würzburg and joined the Task Force during the first Corona lockdown. She did her bachelor's thesis with the Thorn Lab, where she learned programming with Python and worked on the implementation of a GUI for our machine learning tool HARUSPEX in Coot. In the […]
More about this author

Ferdinand Kirsten

Biochemistry B.Sc. Student @ Rudolf Virchow Center, Würzburg University
Ferdinand did his bachelor's thesis at Thorn Lab on solvent exchange and interactions in macromolecular crystallography. Still new to the world of crystallography and structural refinement, he tries to help wherever he can, with a main focus on literature and genome research as well as structural refinement with Coot. Even if he's more of the […]
More about this author

Kristopher Nolte

Biochemistry B.Sc. Student @ Rudolf-Virchow Center, Würzburg University
Kristopher joined Thorn Lab as part of his bachelor thesis. In this thesis he refined aspects of the diagnostic tool for graphical X-Ray data analysis (AUSPEX) with the help of machine learning. But since the corona crisis halted all our lives, he contributes to the Task Force by using his knowledge of bioinformatics and programming […]
More about this author

Erik Nebelung

Nanoscience M.Sc. Student @ Institute for Nanostructure and Solid-State Physics, Hamburg University
Erik is studying nanoscience with a focus on biochemical methods and applications. From August 2020 till January 2021 he pursued his studies at the iNano institute in Aarhus, before starting his master's thesis back in Hamburg. He had his first taste of protein crystallization during his bachelor's thesis work and this sparked his interest in […]
More about this author

Toyin Akinselure

Nanoscience M.Sc. Student @ Institute for Nanostructure and Solid-State Physics, Hamburg University
Toyin ist a microbiologist and presently an M.Sc. student in nanoscience with a focus on nanobiology and nanochemistry. She is interested in scientific research especially in protein chemistry and drug discovery. In the previous autumn and winter, she interned with two research projects, one in drug discovery and the other in protein structure. She found […]
More about this author

Lea von Soosten

Physics M.Sc. Student @ Institute for Nanostructure and Solid-State Physics, Hamburg University
Lea is a M.Sc. physics student with a great interest in everything related to biology. Even though she comes from a different field, she joined the team to expand her knowledge in biochemistry and help the Task Force with a main focus on literature research. Also, she loves drawing!
More about this author

Sabrina Stäb

Biotechnology M.Sc. Student @ Institute for Nanostructure and Solid-State Physics, Hamburg University
Sabrina is studying biochemistry (M.Sc.) and works as a research assistant for the Thorn Lab and the CSTF. During her bachelor thesis on "Crystallization and Structure Solution of High-Quality Structures for MAD Experiments", she was able to gain a lot of experience in the field of crystallography and now brings this experience to the project. […]
More about this author

Alexander Matthew Payne

Chemical Biology Ph.D. Student @ Chodera Lab, Memorial Sloan Kettering Center for Cancer Research, New York, U.S.
Alex is a Ph.D. student interested in understanding how proteins move! He has recently joined the labs of John Chodera and Richard Hite to work on a joint project involving molecular dynamics and Cryo-EM. His goal is to generate conformational ensembles from Cryo-EM data and simulate the ensemble using massive scale molecular dynamics via Folding@Home. […]
More about this author

Maximilian Edich

Bioinformatics Ph.D. Student @ Institute for Nanostructure and Solid-State Physics, Hamburg University
Max studied bioinformatics and genome research in Bielefeld and joined the CSTF as a Ph.D. student in 2021. Previously, his focus was on molecular modeling. Now, he works on the so-called R-factor gap. He already learned what it is like to be part of a young, scientific team as a member of the iGEM contest […]
More about this author

Agnel Praveen Joseph

Computational Scientist @ Science and Technology Facilities Council, UK
Dr. Agnel Praveen works as a computational scientist in the CCP-EM team at the Science and Technology Facilities Council, UK. He is interested in approaches to interpret and validate maps and atomic models derived from Cryo-EM data and looks also into computational methods for the interpretation of Cryo-ET data. In collaboration with five other sites […]
More about this author

Dale Tronrud

Research Scientist @
Dale Tronrud has both solved protein crystal structures and developed methods and software for the optimization of macromolecular models against X-ray data and known chemical structural information. He has had a long-standing interest in enzyme:inhibitor complexes and photosynthetic proteins, focusing on the Fenna-Matthews-Olson protein. In addition, he has also been involved in the validation and […]
More about this author

Sam Horrell

Beamline Scientist @ Diamond Light Source, Oxfordshire, UK
Sam is a structural biologist working on method development around structural biology at Diamond Light Source, in particular for ways of better understanding how enzymes function through the production of structural movies. Sam is working through deposited structures related to SARS-CoV and SARS-CoV-2 with a view to providing the most accurate protein structures possible for […]
More about this author

Cameron Fyfe

Postdoctoral Research Associate @ Micalis Institute, INRAE, Paris, France
Cameron is a structural biologist who has worked extensively on proteins from microorganisms. With many years of experience in the pharmaceutical industry and in structural biology research, he joined the Task Force to contribute his skills to improve existing models for drug development. He is currently researching Radical SAM enzymes at INRAE. When not in […]
More about this author

Tristan Croll

Postdoctoral Research Associate @ Cambridge Institute for Medical Research, University of Cambridge
Tristan is a specialist in the modelling of atomic structures into low-resolution crystallographic and cryo-EM density, and developer of the model-building package ISOLDE. His focus in the project is on correcting the various errors in geometry and/or chemical identity that tend to occur in less well-resolved regions, with the overall aim of bringing the standards […]
More about this author

Gianluca Santoni

Serial Crystallography Data Scientist @ European Synchrotron Radiation Facility, Grenoble, France
Gianluca is an expert in protein crystallography data collection and analysis. After a PhD in structure-based drug design, he has worked as a postdoc on the beamline ID23-1 at the European Synchrotron Radiation Facility (ESRF) and has developed the SSX data analysis software ccCluster. His current interests are the optimization of data collection strategies for […]
More about this author

Yunyun Gao

Postdoctoral Research Associate in the AUSPEX Project @ Institute for Nanostructure and Solid-State Physics, Hamburg University
Yunyun is a method developer for strategies of analysing data from biomacromolecules. Before joining the Thorn group, he had been working on SAXS/WAXS of polymers and proteins. He is interested in improving objectivity and reliability of data analysis. Yunyun is currently extending the functionality of AUSPEX. He is the repository manager and AUSPEX handler for […]
More about this author

Johannes Kaub

Scientific Coordinator @ Institute for Nanostructure and Solid-State Physics, Hamburg University
Johannes Kaub studied chemistry at RWTH Aachen, with a focus on solid-state physical chemistry, before serving as a scientific employee at the Max Planck Instiute for the Structure and Dynamics of Matter. He supports the Coronavirus Structural Task Force as a scientific coordinator with his organizing ability and his talent for solving problems. Other than […]
More about this author

Andrea Thorn

Group Leader @ Institute for Nanostructure and Solid-State Physics, Hamburg University
Andrea is a specialist for crystallography and Cryo-EM structure solution, having contributed to programs like SHELX, ANODE and (a little bit) to PHASER in the past. Her group develops the diffraction diagnostics tool AUSPEX, a neural network for secondary structure annotation of Cryo-EM maps (HARUSPEX) and enables other scientists to solve problem structures. Andrea is […]
More about this author

One comment on “How reliable is the Pfizer-BioNTech claim that their vaccine is 90 percent effective?”

  1. Thanks for the diligence and making your font easily readable! At least until we got to the "Leave a Reply" section.

Leave a Reply

Your email address will not be published. Required fields are marked *

cross